Dell HPC Application Performance Study on 4S Servers
Summary
HPC Application Performance Study on Dell PowerEdge R920 4S server. Benchmarks HPL, STREAM, WRF, and Fluent workloads comparing Ivy Bridge EX processors to previous generation. Demonstrates performance gains in high-performance computing environments with up to 6TB memory. Target users: HPC administrators and data center architects.
Page 1 Text Content
HPC Application Performance Study on 4S Servers
by Ranga Balimidi, Ashish K. Singh, and Ishan Singh
What can you do with a big bad 4-socket machine with 60 cores with up to 6TB memory in HPC? To help answer that
question, we conducted a performance study using several benchmark suites such as HPL, STREAM, WRF and
Fluent. This blog describes some of our results that help illustrate the possibilities. The server that we used for this
study is the Dell Power Edge R920. This server supports the family of processors in the Intel architecture code named
Ivy Bridge EX.
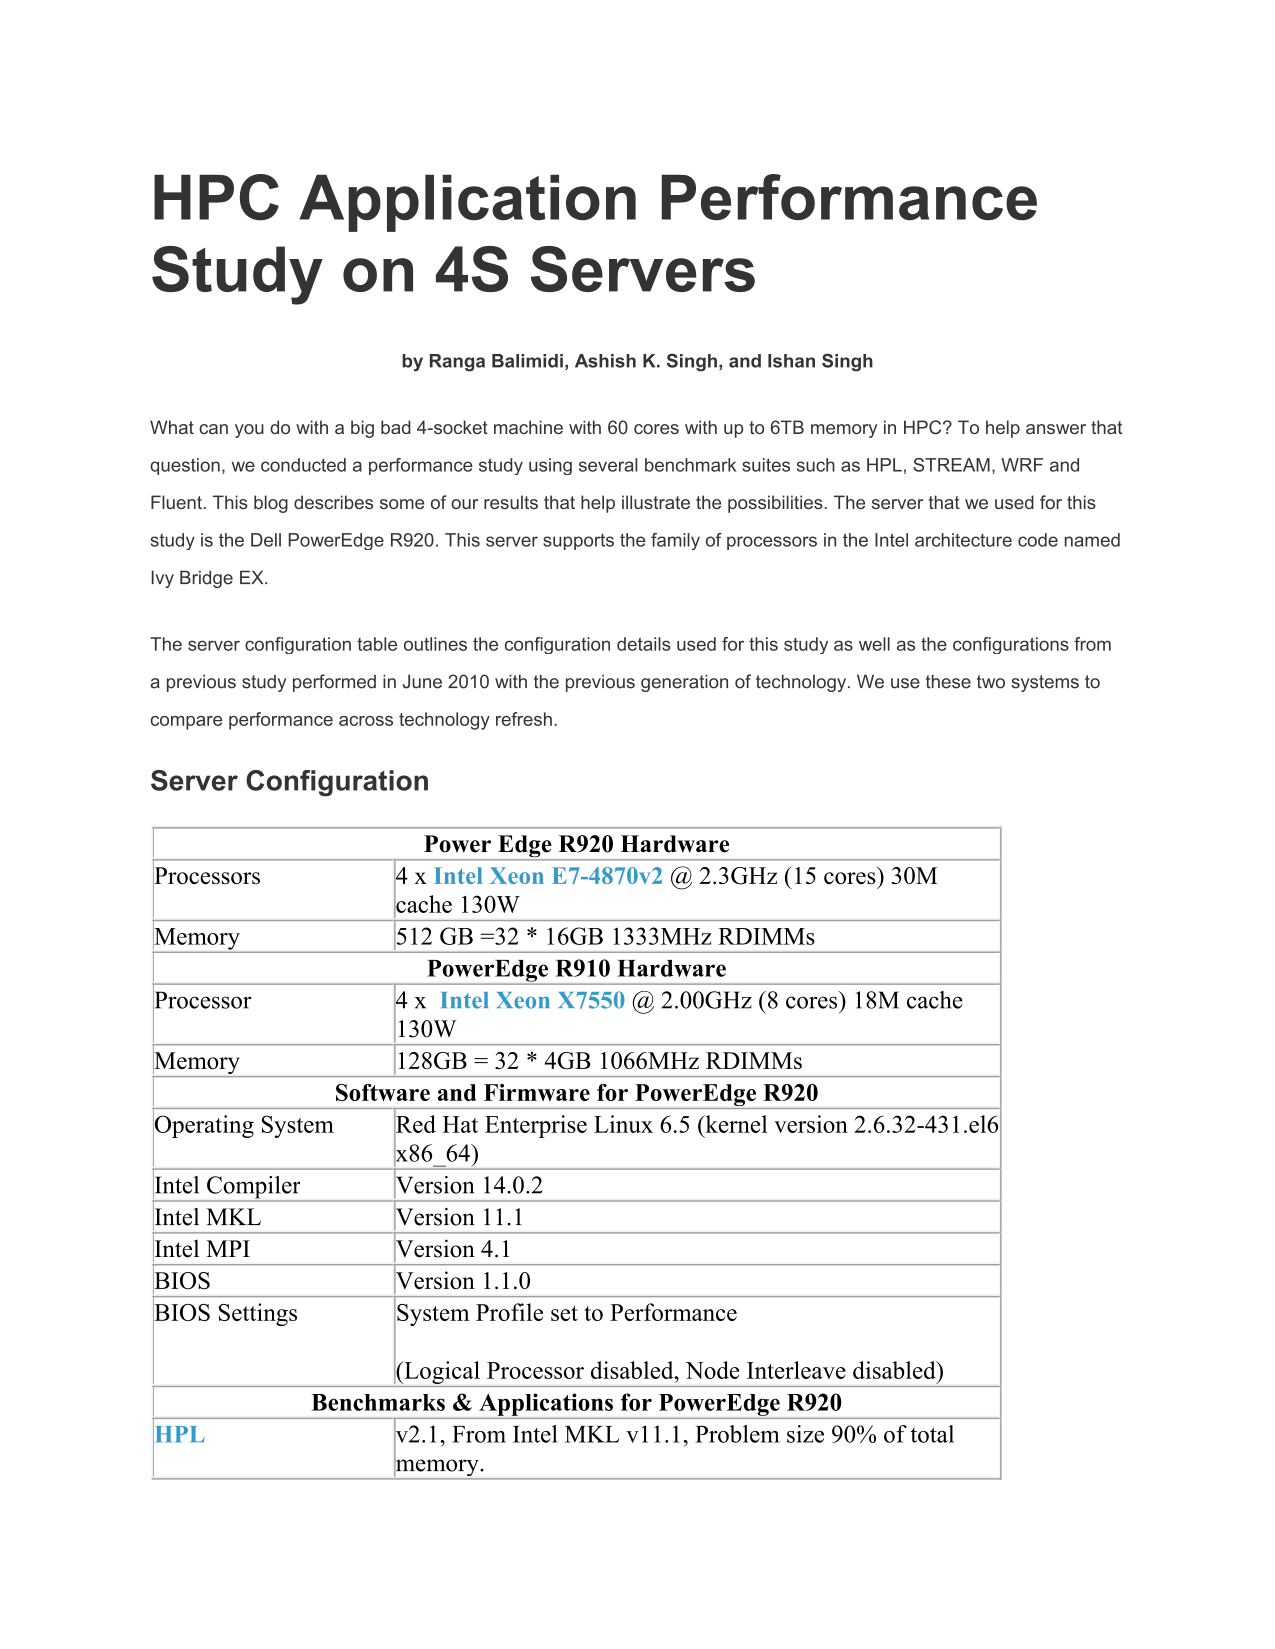
The server configuration table outlines the configuration details used for this study as well as the configurations from
a previous study performed in June 2010 with the previous generation of technology. We use these two systems to
compare performance across technology refresh.
Server Configuration
Power Edge R920 Hardware
Processors 4 x Intel Xeon E7-4870v2 @ 2.3GHz (15 cores) 30M
cache 130W
Memory 512 GB =32 * 16GB 1333MHz RDIMMs
Power Edge R910 Hardware
Processor 4 x Intel Xeon X7550 @ 2.00GHz (8 cores) 18M cache
Memory 128GB = 32 * 4GB 1066MHz RDIMMs
Software and Firmware for Power Edge R920
Operating System Red Hat Enterprise Linux 6.5 (kernel version 2.6.32-431.el6
Intel Compiler Version 14.0.2 Intel MKL Version 11.1 Intel MPI Version 4.1 BIOS Version 1.1.0 BIOS Settings System Profile set to Performance
(Logical Processor disabled, Node Interleave disabled) Benchmarks & Applications for Power Edge R920
HPL v2.1, From Intel MKL v11.1, Problem size 90% of total
memory.
Page Summary Contents For Dell HPC Application Performance Study on 4S Servers
Manual Details
| Brand | Dell |
|---|---|
| Pages | 7 |
| File Size | 337.29 KB |
| Published | June 25, 2026 |
Enter the captcha to get the download link:

Frequently Asked Questions
What is the maximum memory support for this server model?
The platform supports up to 6TB of large shared memory.
Which benchmark is used to measure sustained memory bandwidth?
STREAM is the benchmark used, which evaluates memory bandwidth using COPY, SCALE, SUM, and TRIAD programs.
What factor drives the performance increase when comparing server generations?
The biggest performance difference comes from improvements in system architecture, increased number of cores, and better memory speed.
How is remote memory bandwidth limited compared to local bandwidth?
Remote memory bandwidth is 72% lower than local memory bandwidth due to limitations associated with the QPI link.