ViewSonic TD2430 Touch Display Series User Guide Carbon Footprint Report
Summary
ViewSonic is committed to sustainability, and this report details our effort to quantify the monitor's environmental impact. Covering the entire product life cycle, we estimate carbon emissions from materials sourcing, manufacturing, distribution, and end-of-life management using advanced Life Cycle Assessment tools. Gain transparency into the operational efficiency and environmental responsibility built into your ViewSonic TD2430 Monitor. It is essential reading for customers prioritizing eco-conscious electronics and corporate sustainability metrics.
Page 1 Text Content
View Sonic TD2430 Monitor Report produced September, 2020
As part of View Sonic’s pledge to corporate citizenship and lowering our environmental footprint, we strive to serve the community by better understanding the significance of the product life cycle through product carbon footprinting. That process includes the estimation of emissions from materials, production, distribution, and end-of-life management.
This product’s estimated carbon footprint:
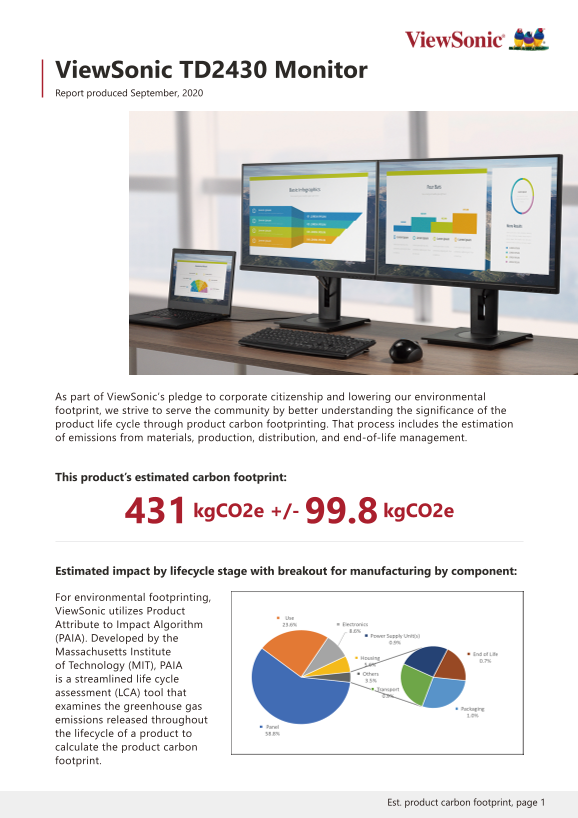
431 kg CO2e +/- 99.8 kg CO2e Estimated impact by lifecycle stage with breakout for manufacturing by component: For environmental footprinting, View Sonic utilizes Product Attribute to Impact Algorithm
(PAIA). Developed by the Massachusetts Institute of Technology (MIT), PAIA is a streamlined life cycle assessment (LCA) tool that examines the greenhouse gas emissions released throughout the lifecycle of a product to calculate the product carbon footprint.
Est. product carbon footprint, page 1
Page Summary Contents For ViewSonic TD2430 Touch Display Series User Guide Carbon Footprint Report
Manual Details
| Brand | VIEWSONIC |
|---|---|
| Pages | 2 |
| File Size | 1.52 MB |
| Published | May 30, 2026 |
Enter the captcha to get the download link:
